Presentation of two-pulse MAS applet panel
This applet allows us to simulate the two-step experiment described in the introduction web page. Only the first-order quadrupole interaction for powder sample rotating at the magic angle is taken into account during the pulses.

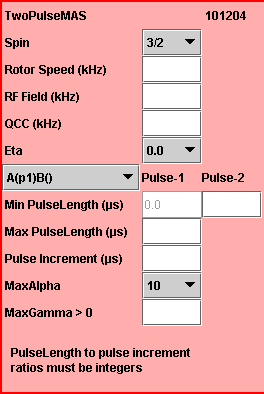
The left-hand part of the simulation panel indicates the physical parameters. It is initialized for a spin I = 3/2 in a powder sample. We can select another half-integer quadrupole spin (5/2, 7/2, or 9/2) with the first choice box.
First, we provide the rotor spinning speed, the strength of the RF magnetic field of the NMR probe, and the quadrupole coupling constant QCC of the sample in kHz unit using the corresponding text fields. We also select the asymmetry parameter eta of the sample with the corresponding choice box.
Second, we select one of the two steps for the optimization
of the central-line intensity with the middle choice box.
(i) A()B(p2): the first step where p1 is constant
and p2 is variable;
(ii) A(p1)B(): the second step where p1 is variable
and p2 is constant.
Third, we provide a pulse length in the Min PulseLength text field for the constant pulse, the last pulse length of the variable pulse in the Max PulseLength text field, and the increment of the variable pulse in the Pulse Increment text field in µs unit. The pulse length to pulse increment ratios must be integers.
Fourth, we select the number of integration steps for alpha and for beta Euler angles with the MaxAlpha choice box. We also provide that for gamma Euler angle in the MaxGamma text field.

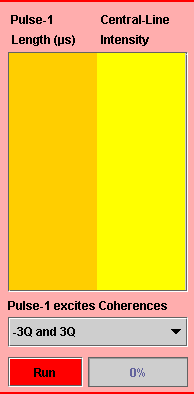
Fifth, we select the two multiquantum coherences excited by the first pulse with the Pulse-1 Excites Coherences choice box located at the bottom of the middle part of the simulation panel.
Finally, we press the red Run button to start the simulation. As a result, this button becomes the Stop button and the progress bar, located on the right-hand side of the red button, starts. We can press the Stop button at any moment to interrupt the simulation.
At the end of the simulation, the central-line intensity versus the variable pulse length will appear as numerical data in the corresponding text areas as well as a graph on the right-hand part of the simulation panel. These numerical data can be pasted into a spreadsheet software such as MS EXCEL.
