9 - Pure absorption 2D lineshape
Pure absorption 2D lineshape provides better resolution than 2D lineshape in magnitude mode.
(1) If the three anti-echo files are not on the desktop, we recall them by selecting the menu items:
Data/antiecho
(2) We reverse the 2D anti-echo spectrum by selecting the menu items:
Process/Reverse Data

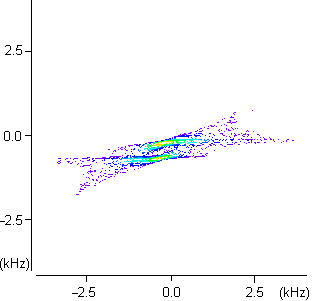
Figure 1
Intensity plot of the reversed 2D anti-echo spectrum:
Both axes are labeled in frequency units.
The reason for reversing the 2D anti-echo spectrum is explained in "Scaling and labeling the high-resolution isotropic axis of two-dimensional multiple-quantum magic-angle spinning spectra of half-integer quadrupole spins" (PDF article, 300 Kb).
(3) We perform the addition of the echo and the anti-echo files by selecting the menu items:
Data/Add Data...

The add-files panel appears. We choose to add antiecho to echo. (The two shadowed rectangles are in fact pop-up lists of filenames, clicking on them allows us to choose files.) A save-file dialog window appears. We call the resulting file total.
Three 2D files corresponding to total MQMAS data are generated on the desktop:
- total -> 2D Data - Stacked Plot
- total -> 2D Data - Line Contour Plot
- total -> 2D Data - Intensity Plot

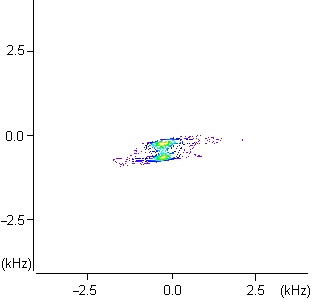
Figure 2
Intensity plot of the 2D MQMAS spectrum with wrong axes:
Both axes are labeled in frequency units.
(4) Since we have transposed the echo and anti-echo files once, we have to transpose once more, for compensation, the total file by selecting the menu items:
Process/Transpose
(5) To follow NMR convention that orientates the F2 axis in ppm unit from the right-hand side to the left-hand side, we reverse the 2D spectrum total by selecting the menu items:
Process/Reverse Data

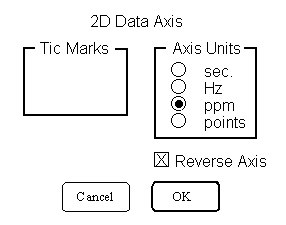
We also reverse the direction of the F2 axis. By clicking
on it, the 2D Data Axis panel appears. We choose the ppm
units and Reverse Axis option.
We also label the F1 axis in ppm units. By clicking on it,
the 2D Data Axis panel appears again. We choose the ppm units
without reversing the axis.

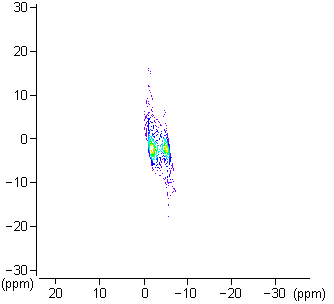
Figure 3
Intensity plot of the final 2D MQMAS spectrum with conventional F2 axis:
Both axes are labeled in ppm units but not scaled yet.
